Average Cost per kWh of Electricity in 2026, by State
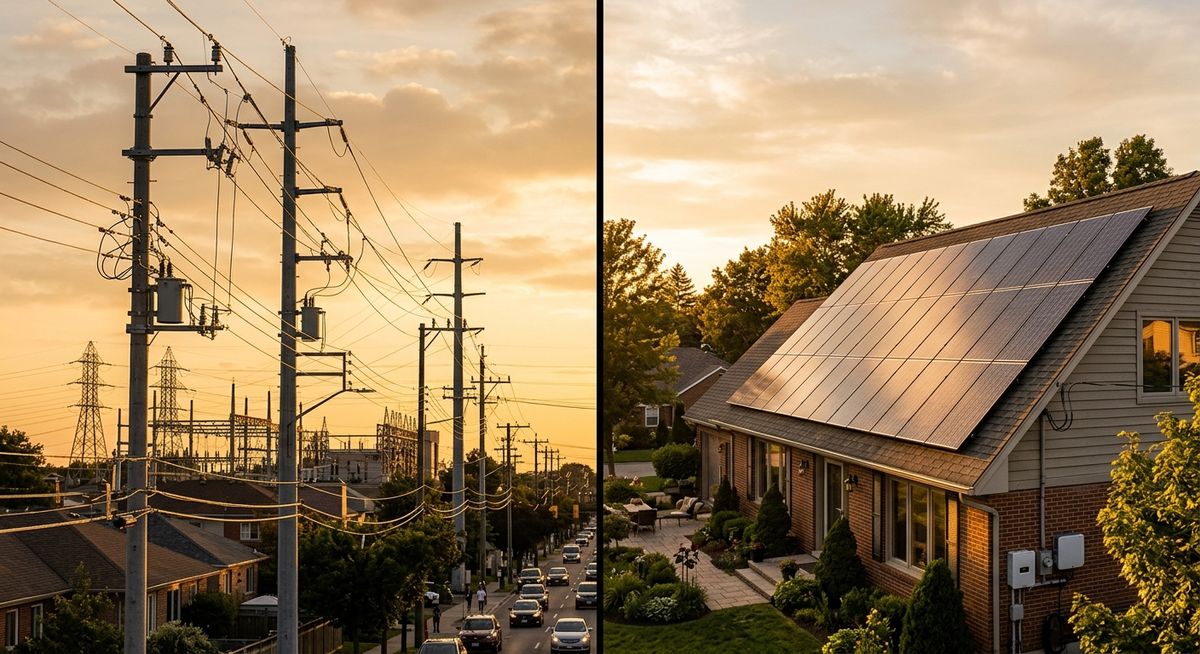
The average residential electricity price in the United States was 18.16 cents per kilowatt-hour (kWh) in August 2026, according to preliminary figures in the U.S. Energy Information Administration (EIA) Electric Power Monthly. That is up from 17.57 cents in August 2025. For the full year, EIA reports that homes paid an average of 17.30 cents per kWh in 2025, and its October 2026 Short-Term Energy Outlook forecasts 18.2 cents for 2026 and 18.7 cents for 2027.
The national number hides a wide spread. Depending on the state, a homeowner can pay less than 13 cents or more than 40 cents for the same kilowatt-hour. Below is what the averages look like by state, why they differ, and how to work out the rate you actually pay, which is the number that matters when you compare grid power with solar.
Average residential price per kWh by state
These are EIA's preliminary residential averages for August 2026, the latest month published at the time of writing. Monthly prices move with the seasons, so treat them as a snapshot rather than a fixed rate. You can sort all 50 states in our Electricity Rates by State tool.
Highest residential prices (August 2026)
- Hawaii: 47.18 cents per kWh
- Maine: 32.11 cents
- Massachusetts: 30.48 cents
- California: 29.75 cents
- Alaska: 29.41 cents
- New York: 28.65 cents
Lowest residential prices (August 2026)
- Nevada: 12.72 cents per kWh
- Louisiana: 12.87 cents
- North Dakota: 13.31 cents
- Utah: 13.31 cents
- Idaho: 13.37 cents
- Tennessee: 13.42 cents
Most states rose compared with August 2025. A few large markets went the other way in that month, including California, Florida, Arizona and Connecticut, so a single year-over-year comparison does not tell you the long-term direction in your state.
Why the price per kWh differs so much
EIA explains in its guide to electricity prices and the factors that affect them that the retail price reflects the cost to build, finance, maintain and operate power plants and the grid, and that generation is the largest single component. The main reasons your state looks different from the national average are:
- Fuel mix. EIA notes that Hawaii's prices are high mainly because most of its electricity comes from imported petroleum fuels.
- Grid costs. Transmission and distribution costs include storm repairs, wildfire and weather hardening, and new lines. Delivering power to individual homes costs more than serving large industrial sites, which is why EIA reports residential customers paid 17.30 cents per kWh in 2025 versus 8.62 cents for industrial customers.
- Regulation and market design. Some states have vertically integrated utilities with rates set by a public utility commission. Others let you choose a retail supplier for the generation part of your bill.
- Season and time of day. EIA notes prices are usually highest in summer, when demand forces more expensive generation online, and wholesale costs peak in the afternoon and early evening.
How to find the rate you actually pay
The state average is a useful benchmark, but your bill can be well above or below it. The simplest way to find your own all-in rate is to divide your total electric charges by the kWh you used.
- Take a recent bill and find the total electric charges (leave out any gas service, late fees or one-time items).
- Find the kWh used during that billing period.
- Divide dollars by kWh. A $150 electric bill for 700 kWh works out to about 21.4 cents per kWh.
- Repeat for a summer and a winter bill, or use 12 months of history, because seasonal rates and usage swing the result.
This effective rate includes fixed monthly charges, which matter more than many people expect. For example, Southern California Edison states that since November 2025 most residential customers pay a $24.15 monthly Base Services Charge set by the state regulator ($12.08 for FERA and $6.00 for CARE customers), while the price of each kWh dropped by roughly 10%. A home using 500 kWh a month would spend about 4.8 cents per kWh on that fixed charge alone. Solar can reduce the per-kWh part of a bill, but not a fixed charge, so read your bill's line items before you estimate savings.
Tiered and time-of-use rates
Many utilities do not charge one flat price. On a tiered plan, the first block of kWh each month is cheaper and usage above it costs more. On a time-of-use plan, power used in the late afternoon and evening costs more than power used overnight or midday. If you are on either plan, ask your utility or check its rate schedule for the price per kWh in each tier or period, since the kWh that solar offsets may not be priced at your average.
What a typical monthly bill looks like
EIA's most recent estimate is that the average U.S. residential customer bought about 10,791 kWh in 2022, or roughly 899 kWh per month. As a rough illustration, 899 kWh at the August 2026 national average of 18.16 cents comes to about $163 for the month. The same usage would cost roughly $114 at Nevada's August average and about $267 at California's. Real bills differ because usage varies by climate, home size, heating type and electric vehicles, and because these averages already blend in fixed charges and taxes.
How the cost per kWh compares with solar
Your grid rate is the price that every kWh of solar you use at home replaces, so it is the starting point for any solar estimate. To compare, you can work out a rough lifetime cost per kWh for a solar system:
- Start with the full installed price from a written quote. See our solar panel cost guide for typical ranges.
- Subtract only incentives you have confirmed you qualify for. The federal 30% Residential Clean Energy Credit is no longer one of them for most buyers: the IRS states it is not available for property placed in service after December 31, 2025.
- Estimate annual production from your installer's design or a production tool, then multiply by the years you expect to own the system.
- Divide the net cost by lifetime kWh, then add expected maintenance, inverter replacement and any loan interest.
Using hypothetical round numbers, not a quote: a $20,000 system producing 9,000 kWh a year for 25 years works out to about 8.9 cents per kWh before panel degradation, maintenance and financing, which push the figure higher. Whether that beats your grid rate depends on what your utility credits for power you export. Under full retail net metering, exported kWh are worth close to your retail rate. Under net billing or reduced export rates, exported kWh can be worth much less, so homes that use more of their solar on site, or add a battery, get more value. Our guide on how net metering works covers the differences.
Leases and power purchase agreements (PPAs) price solar differently: you pay a monthly fee or a set price per kWh to the company that owns the system. Compare that price with your effective grid rate, and check for an annual escalator, what happens if you sell the home, and who keeps any incentives tied to the system.
Will electricity prices keep rising?
EIA's October 2026 outlook expects the average residential price to rise from 17.3 cents in 2025 to 18.2 cents in 2026 and 18.7 cents in 2027. Forecasts are not guarantees, and local rate cases can move your price more than the national trend. When you run a solar estimate, try a flat-rate scenario as well as a rising one so the decision does not depend on one assumption. You can test both in our solar payback calculator.
Frequently Asked Questions
What is the average cost per kWh of electricity in the US?
EIA reports the average U.S. residential price was 18.16 cents per kWh in August 2026 (preliminary) and 17.30 cents for all of 2025. Its October 2026 outlook forecasts an average of 18.2 cents for 2026. Your own rate can be much higher or lower depending on your state, utility and plan.
Which state has the most expensive electricity per kWh?
Hawaii has the highest residential price, at 47.18 cents per kWh in EIA's preliminary August 2026 data. EIA attributes Hawaii's high prices mainly to its reliance on imported petroleum fuels for power generation. Maine, Massachusetts, California and Alaska were also near the top.
Which state has the cheapest electricity per kWh?
In EIA's preliminary August 2026 data, Nevada had the lowest residential average at 12.72 cents per kWh, followed closely by Louisiana, North Dakota, Utah and Idaho. Monthly rankings shift with the seasons, so compare several months before drawing conclusions.
How do I calculate my cost per kWh from my bill?
Divide your total electric charges by the kWh used in the same billing period. For example, $150 for 700 kWh is about 21.4 cents per kWh. Check bills from different seasons, since summer and winter rates and usage often differ.
Is 15 cents per kWh a good electricity rate?
At 15 cents, you would be below the August 2026 national residential average of 18.16 cents reported by EIA. Whether it is good for you depends on your state, since many Southern and Mountain states average 13 to 16 cents while much of the Northeast is above 24 cents.
Does solar lower my cost per kWh?
Solar replaces the kWh you would otherwise buy from the grid, so it reduces the usage-based part of your bill. It does not remove fixed monthly charges, and the value of power you export depends on your utility's net metering or export credit rules. Any savings are an estimate that depends on your usage, roof, rate plan and financing.